- By clara tj
- October 8, 2025
- Freight Forwarding, Logistics
When global trade shifts, importers rely on reliable indicators to plan shipments and control costs. The China Container Freight Index (CCFI) reflects rate movements across China’s major ports and gives valuable insight into logistics pricing trends. At Top China Forwarder, we help businesses interpret these changes and optimize freight strategies for long-term savings.
What Is the China Container Freight Index (CCFI)?
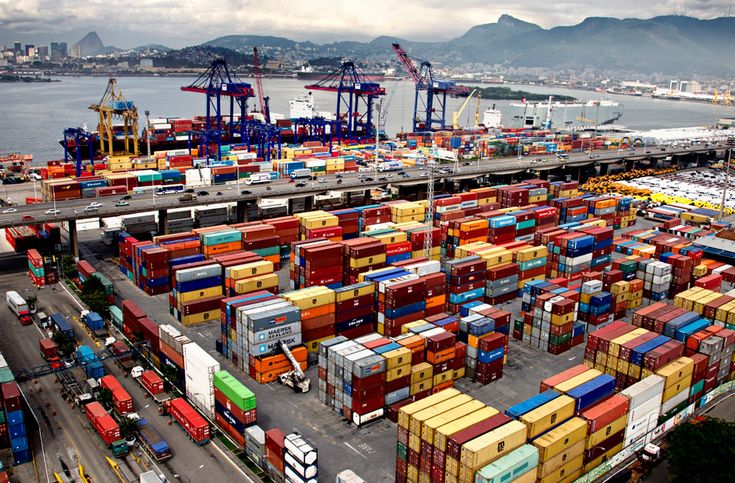
The China Container Freight Index measures container shipping rates from China’s major export hubs — including Shanghai, Ningbo, Shenzhen, and Qingdao — to key global markets. Managed by the Shanghai Shipping Exchange, it represents average contract and spot freight rates across dozens of routes.
Unlike spot indices such as the SCFI, which tracks immediate rates, the CCFI captures comprehensive long-term pricing — making it ideal for evaluating logistics performance and forecasting costs.
Why Does the CCFI Matter to Global Traders?
Understanding the CCFI allows shippers and importers to:
- Anticipate freight-rate movements months in advance.
- Benchmark contract negotiations with carriers.
- Forecast total landed costs more accurately.
- Identify optimal timing for booking containers.
For importers managing high-volume shipments, the CCFI provides visibility to protect profit margins. Businesses using Sea Freight services can adjust booking windows to avoid seasonal peaks.
👉 Need better freight planning? Send Inquiry
How Is the CCFI Calculated?
The index aggregates data from more than 20 shipping routes covering Asia, Europe, North America, South America, and Oceania. Each route is weighted according to China’s export volume.
| Route Region | Weight in Index (%) | Example Ports |
|---|---|---|
| Europe | 25% | Shanghai–Rotterdam, Ningbo–Hamburg |
| North America | 20% | Shenzhen–Los Angeles, Qingdao–New York |
| Mediterranean | 15% | Xiamen–Barcelona, Ningbo–Genoa |
| Southeast Asia | 10% | Shanghai–Singapore, Qingdao–Bangkok |
| Others | 30% | Africa, Oceania, Latin America |
Each week, freight data from leading shipping companies and forwarders is compiled to update the CCFI, giving a consistent reflection of international shipping dynamics.
CCFI vs. SCFI: What’s the Difference?
| Index | Type | Frequency | Best For |
|---|---|---|---|
| CCFI | Contract + Spot Rates | Weekly | Long-term logistics planning |
| SCFI | Spot Rates Only | Weekly | Short-term market reaction |
For companies shipping continuously, the CCFI is the more strategic benchmark. However, the Shanghai Containerized Freight Index (SCFI) helps analyze immediate market volatility. Combining both gives a full picture of cost movement.
2025 CCFI Market Overview
The 2025 outlook shows moderate rate stabilization after years of extreme volatility. Factors driving this year’s performance include:
- Reduced port congestion across Asia–Europe routes.
- Improved container availability due to balanced demand.
- Stable fuel prices moderating freight surcharges.
- Geopolitical shifts influencing routing and capacity allocation.
Average CCFI 2025 (Jan–Sep):
| Month | CCFI Index Value | Monthly Change | Key Driver |
|---|---|---|---|
| January | 930 | — | Slow Q1 exports |
| April | 1,050 | +12.9% | Seasonal restocking |
| July | 1,180 | +12.4% | Demand from Europe |
| September | 1,140 | –3.3% | Off-peak correction |
Despite regional fluctuations, the trend remains stable and predictable — ideal for long-term shipping contracts.
What Affects China’s Container Freight Index?
Several macro factors drive CCFI trends:
- Fuel Prices: Bunker adjustment factors directly affect all-in freight rates.
- Container Availability: Shortages raise surcharges, while surpluses drive discounts.
- Trade Policies: Tariffs and customs regulations reshape regional shipping demand.
- Port Congestion: Bottlenecks add delay surcharges.
- Economic Growth: Strong import demand in the US or EU boosts freight pricing.
Shippers using Air Freight for urgent cargo can avoid sudden maritime slowdowns.

CCFI and Supply Chain Strategy
Logistics managers use the CCFI to balance cost and delivery speed. For instance:
- When the CCFI rises above 1,200 points, many exporters shift partial cargo to Rail Freight via China–Europe routes.
- When rates drop below 900 points, sea freight becomes the most efficient mode.
Such flexibility ensures smooth supply-chain performance, especially when combined with Door to Door logistics.
👉 Get rate forecasts customized for your route. Send Inquiry
CCFI and Shipping Mode Comparison
| Mode | Average Cost (USD/kg) | Transit Time | Pros | Cons |
|---|---|---|---|---|
| Air Freight | $4–$7 | 5–7 days | Fast, reliable | Expensive |
| Sea Freight | $0.5–$1.5 | 25–40 days | Cheapest for volume | Slow |
| Rail Freight | $2–$3 | 15–20 days | Balanced option | Limited regions |
Importers combining Sea + Rail gain better control over overall lead time and cost predictability.
How Traders Can Use the CCFI to Cut Costs
- Book shipments early before the CCFI peak periods (May–August).
- Negotiate contracts indexed to CCFI values for transparent pricing.
- Diversify routes — using inland rail hubs when sea lanes are congested.
- Bundle services such as Warehouse consolidation to lower per-unit cost.
- Monitor market signals from Shanghai Shipping Exchange weekly.
Proactive importers save up to 12–18% on annual logistics budgets by aligning with index cycles.
Case Example: Exporter Using CCFI Trends for Profit
A textile exporter in Ningbo was shipping 5×40HQ containers monthly to Germany. When CCFI surged to 1,250 in Q2 2024, they switched to China–Europe rail freight for 60% of volume.
Result:
- Transit time reduced from 35 to 18 days.
- Costs lowered by 11% over three months.
- Improved delivery reliability for European retailers.
Such agility, guided by CCFI data, provides a competitive advantage for global importers.
Conclusion:
The China Container Freight Index (CCFI) remains the most reliable measure of maritime logistics performance in 2025. By tracking it regularly and aligning booking cycles with market movements, businesses can reduce freight costs and stabilize delivery schedules. With strategic guidance from Top China Forwarder, global importers gain the clarity needed to navigate rate volatility and secure efficient supply chains.
Looking to optimize freight planning and control your logistics expenses?
Get your personalized quote today — we respond in under 24 hours with the best routes and rates.
Access exclusive 2025 freight discounts and manage your shipping smarter with Top China Forwarder.
FAQs
Q1: What does the China Container Freight Index measure?
It tracks average container freight rates from major Chinese ports to global destinations, combining spot and contract prices.
Q2: How often is the CCFI updated?
The index is updated weekly by the Shanghai Shipping Exchange to reflect the latest rate trends.
Q3: Why is the CCFI important for importers?
It helps businesses anticipate rate changes, negotiate better contracts, and plan logistics budgets effectively.
Q4: What’s the difference between CCFI and SCFI?
CCFI reflects long-term contract + spot rates; SCFI focuses solely on spot rates for immediate shipments.
Q5: Can CCFI predict future freight rates?
While not a forecast, its trend patterns often indicate general market direction for upcoming months.
Q6: How can I lower my freight cost using CCFI data?
Book during low-index periods, consolidate cargo, and partner with experienced forwarders to negotiate index-linked rates.